top of page


Data & Maps
iMapInvasives Data
iMapInvasives Data
iMapInvasives is a collaborative GIS-based invasive species database for presence, not-detected, and treatment records entered by professionals and citizen scientists. Taxonomic experts across the state review and confirm the species identity of presence records. View iMapInvasives data.
Contribute data
To record an observation, please see our Report an Invasive page.
If you have an invasive species dataset including over 100 records that you would like to contribute, please email us at imapinvasives@dec.ny.gov
Using and analyzing iMap data
Much of the data in iMapInvasives database is available for use via Exports and Web Map Services.
Prioritizaton Analysis
Tools & Data Viewers
NY iMapInvasives and partners have created numerous tools to collect, view and analyze invasive species data. This section includes all of our publicly accessible online maps, dashboards, prioritization models and data viewers. For professionals looking to access more advanced tools, please email us at imapinvasives@dec.ny.gov

Aquatic Invasive Species Pond and Lake Vulnerability Prioritization: Allows users to select risk thresholds for invasive species introduction, establishment, and impact to help prioritize aquatic invasive species surveys and management efforts of lakes.
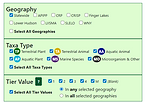
Invasive Species Tiers: Ranking system for of high-impact invasive species based on iMap distribution data and expert opinion, for each PRISM and statewide. Results displayed in online table.

Management Outcomes Viewer: Evaluates the outcomes of invasive species management efforts by organizing data into management sites based on location and species, then
assigning outcomes based on the data available for each site.

Terrestrial Invasive Species Prioritization Tool: Framework that scores the landscape based on ecological value, natural and protected areas, and risk of spread. Scores displayed in map viewer that managers can use to guide terrestrial surveys and management priorities.

Waterbody Lookup Tool (WaLT): Uses data from NY iMapInvasives to quickly provide a list of aquatic invasive species reported in a selected waterbody, or a list of waterbodies in which a selected species has been documented.
Exports & WMS
Exports & Web Map Services (WMS)
Are you interested in using iMap data in spatial analyses, overlaying iMap data with your own data, or displaying iMapinvasives data on your website? Use the iMap3 Web Map Services (WMS) for live data, or export data from the online interface. For information on using iMapInvasives Data and proper citation, please see the iMapInvasives Terms of Use.
Web Map Services
Connect to live iMapInvasives data directly from online and desktop GIS software using the iMap3 WMS.

View our Maps and Dashboards to see examples of what you can do with iMap3 Web Map Services.
Data Exports
Users can download up to 10,000* records at a time using the iMap online interface. Users must first create an account.

*If you need more than 10,000 records, please fill out the Bulk Data Request Form.
bottom of page